


One of the goals of these Views is to provide both a wide and deep view of shopping. Wide means ultimately all retail, everywhere around the globe. This wide view encompasses cataloguing and classifying all quadrillion seconds that shoppers around the world spend annually in the variety of stores they visit. The deep means driving down to an understanding of single purchases for single shoppers.
For those not familiar with the quantitative aspects of shopping, perhaps the single most salient fact is that purchases often occur at blazing speed, measured in a few seconds. Understanding three basic dimensions of shopping can help with coming to grips with this:
The First Dimension of an Individual Purchase
For years, many have relied on a statistic provided by POPAI, to the effect that "70% of all purchase decisions are made in the store." This has recently been challenged and updated by an OgilvyAction study that found the number to be about 40%. However, both of these studies are probably assuming that every purchase involves making a decision. This seems to be a dubious proposition, given the speed at which purchases occur. In reality, many purchases do NOT involve a current decision:
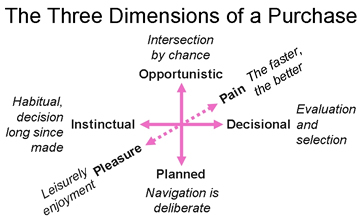
The first dimension contrasts the decisional purchase from an instinctual purchase. Many purchases can occur on a nearly subconscious, or "autopilot" mode - any real cognitive decision having been made months or even years ago. These are the purchases that occur very quickly - even if finding the right part of the store or display takes awhile.
The Second Dimension of Individual Purchases
In my opinion, way too much thinking about shopping is based on the very mistaken assumption that it is a planned, organized activity. Regardless of individuals' self-perceptions, the facts are that 30%* of ALL purchases, averaged across categories, come from endcaps and other promotional displays. Given that the items sold there represent less than 5%* of all the items in the store, almost certainly the vast majority of those purchases occur solely because the product crossed the shoppers path, as the shopper was on the way to somewhere else. This is what we refer to as an opportunistic purchase. That is, one that occured only because there was an intersection by chance between the shopper and the merchandise, an opportunity. Had this intersection not occured, the purchase would not have occured.
The Third Dimension of Individual Purchases
Shopping is vastly over-rated as a pleasure, by many brands and retailers. However, clearly some purchases do provide pleasure, and may encourage the shopper to linger over their purchase. However, the vast majority of purchases of consumer packaged goods (or FMCG) are at best neutral on this dimension, if not actually painful. Surely a woman dawdling over the cosmetics may have a significant pleasure component. Dawdling over the analgesics is almost certainly NOT a pleasure.
Unfortunately, we do not have perfect, objective metrics for all of these recognized dimensions. However, the amount of time spent, where the purchase occurs, how often it occurs and other factors can have a bearing. We will illustrate in a subsequent Views one such application with an ingenius scheme for matching appropriate promotional strategies to categories, based on objective metrics.
* I have revised our estimate of this number downward, because although there are categories as high as 40%, there are others at 0% (for example, often dairy.) I am engaged in a major study based on visual data and new, more accurate RFID data, to provide a more definitive picture of this important metric. I will also provide definitive clarification of the 5%, which is probably too low, as the 40% is too high. The point will remain that a small fraction of the total offering in the store makes an outsize contribution to the store's sales. I will include an update in a future Views.
- - -